The way shoppers find products is splitting into two tracks. One is the familiar Google-ranking game. The other is happening inside the response window of ChatGPT, Claude, and Gemini — where a shopper asks a natural-language question and receives a curated answer with brand and product recommendations baked in. No ads. No blue links. Just the model's best answer, drawn from whatever it has learned about your brand.
That second track is AEO: AI Engine Optimization. And based on the data we've collected running thousands of structured queries against live LLM APIs for 84 anonymized retail and eCommerce brands, the gap between brands that are visible in AI responses and those that aren't is already significant — and widening.
This post covers what the data actually shows, why the numbers differ so dramatically between models, and the technical infrastructure that the highest-performing brands have built to measure and improve their position. We'll be specific: real query structures, real schema patterns, real alerting logic — not generic advice about "creating quality content."
The Visibility Gap Is Larger Than Most Brands Realize
Our previous aggregate report put average brand visibility at around 27%. With an expanded sample of 84 brands per LLM variant, the picture has sharpened.
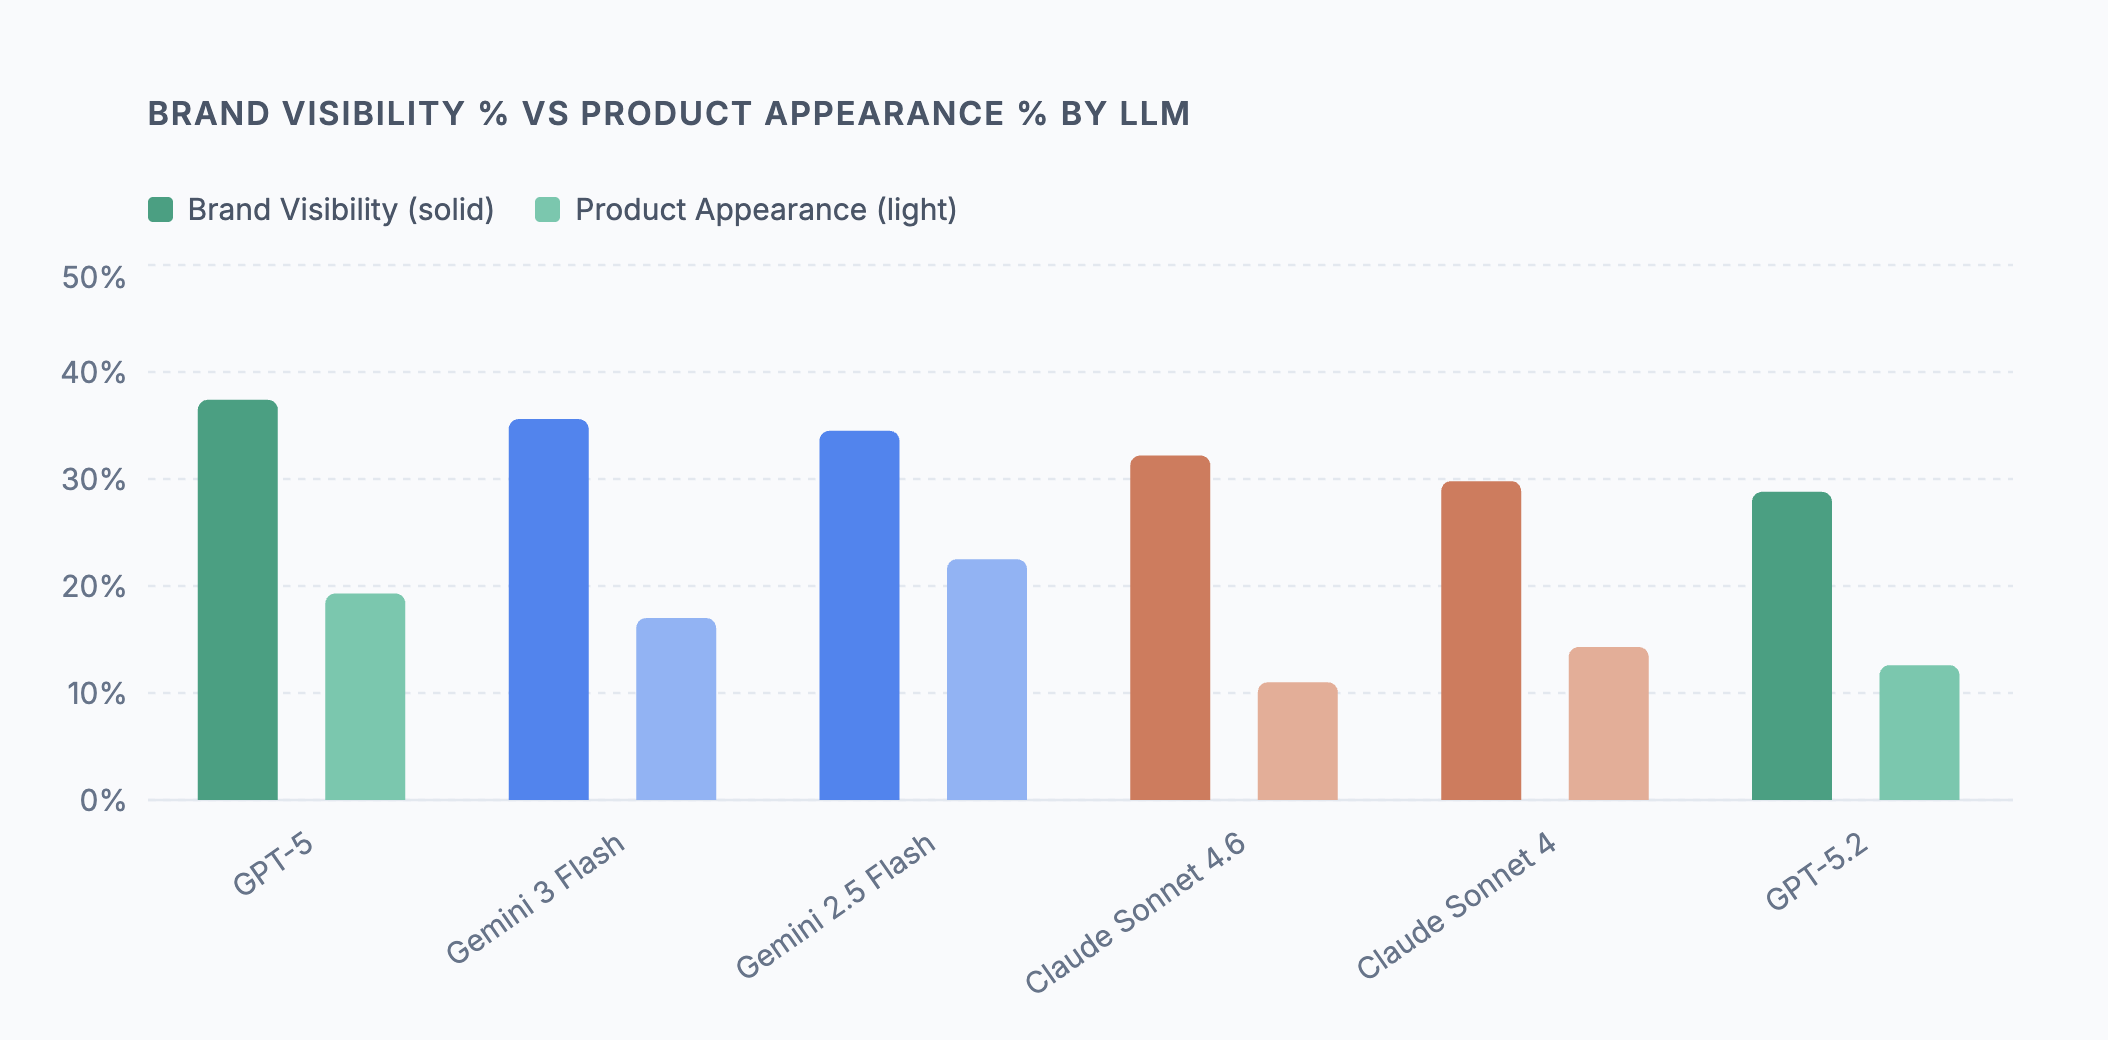
The range across the six models we test is 28.8% to 37.4%. That means even GPT-5 — the most brand-generous model in our dataset — fails to surface a given brand in more than 6 out of 10 relevant queries. For the lower end of the range, it's closer to 7 out of 10 queries where your brand simply does not exist in the AI's response.
Brand Visibility % vs Product Appearance % by LLM
Source: Superpilot AEO analysis — 84 anonymized retail brands per LLM, March 2026
The brand visibility number alone understates the problem. The more operationally important metric is product appearance — how often a specific product gets named, not just the brand. GPT-5 posts 37.4% brand visibility but only 19.3% product appearance. The brand gets a passing mention; the catalog stays invisible. Gemini 2.5 Flash is the outlier in the other direction: 34.5% brand visibility paired with 22.5% product appearance, the highest in our dataset. This likely reflects Google's Shopping Graph integration, which gives Gemini access to structured product data that other models don't have.
The practical implication: a brand visibility score without a product appearance score tells you almost nothing about whether AI is actually driving discovery of your specific products. You need both.
Why the Same Brand Gets Different Results Across Models
The six LLM variants we test aren't producing random variation — the differences are systematic, rooted in how each model was trained, what data it was trained on, and how its RLHF tuning shaped its response style.
Three distinct behavioral profiles emerge from the data:
GPT-5 casts wide but buries the lead. It has the highest brand visibility (37.4%) but the highest average position (9.0) — meaning brands tend to appear deep in longer responses rather than in the opening recommendation. In a high-competitor-density environment (more on this below), being mentioned ninth in a list is a very different outcome from being mentioned second.
Gemini prioritizes catalog depth over brand breadth. Both Gemini variants achieve the highest product appearance rates in our dataset (22.5% and 17.0%), which we attribute to Shopping Graph integration. If your products are properly structured in Google's product index, Gemini has a direct pipeline to cite them. No other provider has an equivalent shortcut.
Claude is selective and prominent. The Claude models have the lowest brand visibility scores (29.8%–32.2%) but the lowest average position when they do mention a brand (3.5–4.5). Claude mentions fewer brands, but when it mentions yours, it leads with it. Getting into Claude's consideration set is harder — but the placement quality is meaningfully better.
The opportunity this creates is real but underutilized: most brands are making content decisions based on a single model's behavior, not a cross-provider picture. Understanding that GPT-5 buries your brand at position 9.0 while Claude leads with it at 4.5 — in the same week, for the same queries — is the kind of insight that changes where you invest. You can't optimize what you can't see across all three providers simultaneously.
The Sentiment Trap: High Scores That Hide Real Problems
Every model we test produces brand sentiment scores that look encouraging on the surface. Scores range from 6.0 to 8.3 out of 10 — solid marks by any report card standard. But these numbers are systematically misleading, for two reasons.
Brand vs Product Sentiment Scores (out of 10) by LLM
Source: Superpilot AEO analysis — 84 anonymized retail brands per LLM, March 2026
First, LLMs are structurally optimistic. RLHF training rewards helpfulness and positivity, which bleeds directly into brand commentary. An 8.3 sentiment score from Gemini doesn't reflect a nuanced positive assessment of your brand — it reflects a model that defaults to positive framing when discussing consumer products. The signal-to-noise ratio on aggregated brand sentiment is low.
Second, product sentiment on Claude tells a completely different story. Claude Sonnet 4.6 shows a brand sentiment of 6.0 — the lowest in our dataset, but still a passing grade. Its product sentiment score is 1.8 out of 10. That gap is not a measurement artifact. Claude is accurately flagging that product-level information — specific SKUs, availability, specs, pricing — is either missing, stale, or inconsistent with what it knows about the brand. Other models paper over these gaps with generic positivity. Claude surfaces them.
This makes Claude product sentiment the single most diagnostic metric in our dataset. A low product sentiment score from Claude is essentially a structured audit finding: your catalog content has gaps that a model specifically tuned for accuracy is identifying and penalizing.
The most operationally dangerous outcome across all models remains availability misinformation. LLMs will confidently state that products are "available now" or "ships within two days" based on training data that may be a year or more out of date. For shoppers, this creates broken expectations. For merchants, it generates returns, support tickets, and review damage that's entirely preventable.
The opportunity here is significant: most brands have no visibility into what AI models are actually saying about their products day-to-day. Catching a misinformation pattern early — before it reaches thousands of shoppers — is entirely achievable with the right measurement loop in place. Superpilot's AEO reporting flags exactly these divergences automatically, surfacing the specific claims that need correcting before they become a customer experience problem.
Competitor Density: The Signal Most Brands Miss
Standard SEO analysis has no equivalent for competitor density — how many competing brands the LLM names in the same response as yours. In AI search, this number matters enormously, because a response that recommends 25 brands and a response that recommends 3 require fundamentally different strategies to win.
Average Competitor Brands Mentioned Per Query by LLM
Source: Superpilot AEO analysis — 84 anonymized retail brands per LLM, March 2026
GPT-5 is the extreme case: 25.5 competing brands per query on average. When GPT-5 responds to a shopping intent query in your category, it's generating a broad consideration list. Being in that list is table stakes. Being in the first two or three positions is the actual win condition.
Claude is the opposite: 8.6–9.4 competing brands per query. A Claude response is a short, opinionated recommendation — closer to a trusted friend's answer than a comparison engine. Getting into Claude's narrow consideration set requires your content to signal genuine category authority, not just brand familiarity.
Gemini sits in the middle at 11.6–12.5, and its competitor density has been stable across our measurement cycles — suggesting the Shopping Graph integration produces more consistent, less variable recommendation sets than the other providers.
What makes competitor density so valuable is that your AI competitive landscape is often a completely different set of brands than your traditional SEO one. A brand that barely registers in your Google Analytics competitive reports may be appearing alongside you in 80% of Claude's category responses. Without measuring this, you have no way to know — and no way to respond. Tracked week-over-week, the competitor density list is frequently the most actionable output of a full AEO audit.
What the Data Points to: Three Prioritized Actions
The four sections above aren't independent observations — they form a diagnostic sequence. Here's what the data directly suggests you should do, and why.
1. Close the Product Appearance Gap — It's Larger Than Your Brand Visibility Score Suggests
Every model in our dataset shows a significant drop between brand visibility and product appearance. The widest gap belongs to GPT-5: 37.4% brand visibility, 19.3% product appearance — an 18-point gap where the brand gets a mention but no specific product does. The narrowest gap is Gemini 2.5 Flash, which we attribute to Shopping Graph integration giving it access to structured product data other models lack.
The implication: if you're only tracking whether your brand appears in AI responses, you're measuring the wrong thing. The question is whether your products appear. The brands in our dataset with the strongest product appearance rates share one characteristic — their product pages have complete, specific, machine-readable structured data. Not vague marketing copy. Specific facts: materials, dimensions, availability, price, ratings.
{
  "@context": "https://schema.org/",
  "@type": "Product",
  "name": "Expedition Parka",
  "brand": { "@type": "Brand", "name": "..." },
  "description": "Waterproof down parka rated to -40°F, with recycled 700-fill power down and a waterproof-breathable shell.",
  "offers": {
    "@type": "Offer",
    "availability": "https://schema.org/InStock",
    "price": "1295.00",
    "priceCurrency": "USD"
  },
  "aggregateRating": {
    "@type": "AggregateRating",
    "ratingValue": "4.7",
    "reviewCount": "312"
  }
}
2. Take Claude's Product Sentiment Score Seriously
The most striking number in our dataset isn't a visibility figure — it's the gap between Claude's brand sentiment (6.0/10) and its product sentiment (1.8/10). No other model shows anything close to this divergence. GPT-5 and both Gemini variants score brand and product sentiment within 1–2 points of each other. Claude's 4+ point gap is a specific finding about catalog content quality, not a quirk of the model.
What makes this actionable: Claude's low product sentiment is highly correlated with the same brands that show low product appearance rates across all models. Claude isn't penalizing those brands arbitrarily — it's accurately identifying that product-level content is thin, stale, or ambiguous. The other models are just less honest about it.
A Claude product sentiment score below 3.0 in your own AEO report is the clearest signal in the data that catalog content work will move your numbers. It's the most specific diagnostic our dataset produces.
3. Know Which Game You're Playing on Each Platform
The competitor density data makes the strategic picture concrete. GPT-5 averages 25.5 competing brands per query — you're competing for attention in a long list. Claude averages 8.6–9.4 — you're competing for one of a handful of slots in a short, opinionated answer. These are not the same challenge, and they don't have the same solution.
For brands in the GPT-5 environment, position within the response matters as much as presence. GPT-5's average position of 9.0 means most brand mentions are buried. Visibility without prominence is low-value. The brands that appear early in GPT-5 responses tend to have strong third-party citation signals — category guides, editorial coverage, and comparison content that positions them as the default reference in their category.
For Claude, the priority is different: get into the consideration set at all. Claude's narrow recommendation set means the bar for inclusion is higher, but the payoff — a position 3.5–4.5 mention in a trusted, prominent recommendation — is more valuable per mention than GPT-5's position 9.0.
What the Data Tells Us About Where This Is Going
Our dataset shows one trend that we think is important: Claude Sonnet 4.6's brand visibility moved from 31.6% to 32.2% in our latest run — a modest but meaningful uptick. Claude's product sentiment (1.8/10) didn't improve, which means the visibility gain didn't come from better catalog content. It likely came from increased query coverage as Claude's usage grows, meaning more shopper queries are reaching the threshold where Claude includes brand mentions at all.
This is the dynamic that makes AEO a moving target: model retraining events, usage shifts between providers, and Shopping Graph updates can all move your numbers without any action on your part — up or down. The brands that will own their AI discoverability are the ones that detect these shifts in days, not quarters.
The early SEO analogy holds, but the timeline is compressed. In 2005, you had years to build your PageRank foundation before SEO became crowded. The equivalent window for AEO is measured in months. The brands in our dataset sitting in the 35–40% visibility range have structured data, fresh content pipelines, and weekly measurement loops. The ones at 28–30% have the same structural opportunities available to them — they just haven't built the infrastructure yet.
The infrastructure is not complicated. The data is telling you exactly where to start.
Methodology: All data from Superpilot AEO analysis, updated March 2026. 84 anonymized retail and eCommerce brands tested across six LLM variants (GPT-5, GPT-5.2, Gemini 3 Flash, Gemini 2.5 Flash, Claude Sonnet 4.6, Claude Sonnet 4). 10 intent queries per brand per LLM per run cycle. No brand names are disclosed in aggregate reporting. Superpilot provides AI discoverability measurement and optimization for eCommerce merchants.